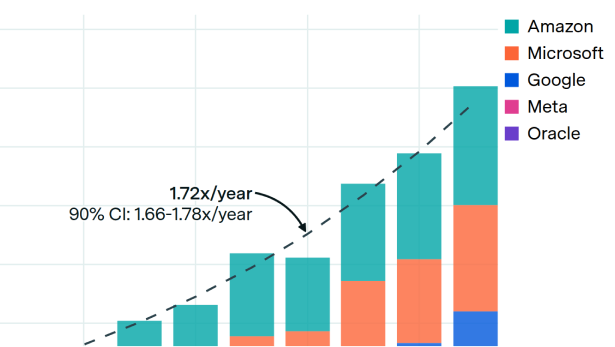
The world’s largest hyperscalers (Microsoft, Amazon, Alphabet, Meta, and Oracle) are increasing their cash capital expenditures faster than their cash inflows from operations. While the exact point at which cash capex will exceed inflows varies by company, aggregate cash capex across hyperscalers is on track to overtake operating cash flow around Q3 2026. Most hyperscalers have already turned to external financing to fund their growing investments in AI infrastructure, or are considering doing so.
| CalendarQuarter | Operating cash flow (CFO) ($B) | Cash capex ($B) | CFO trend ($B) | CapEx trend ($B) |
|---|---|---|---|---|
| CY2022 Q1 | 65.6 | 36.6 | ||
| CY2022 Q2 | 69.2 | 38.4 | ||
| CY2022 Q3 | 74.0 | 41.0 | ||
| CY2022 Q4 | 79.3 | 41.9 | ||
| CY2023 Q1 | 71.0 | 36.6 | ||
| CY2023 Q2 | 96.9 | 35.4 | 94.7 | 33.2 |
| CY2023 Q3 | 109.8 | 38.3 | 99.8 | 37.8 |
| CY2023 Q4 | 99.8 | 44.1 | 105.1 | 43.2 |
| CY2024 Q1 | 104.5 | 46.0 | 110.8 | 49.3 |
| CY2024 Q2 | 114.6 | 55.6 | 116.7 | 56.3 |
| CY2024 Q3 | 123.0 | 61.2 | 123.0 | 64.3 |
| CY2024 Q4 | 136.3 | 76.3 | 129.6 | 73.4 |
| CY2025 Q1 | 120.2 | 77.8 | 136.6 | 83.8 |
| CY2025 Q2 | 134.6 | 97.3 | 144.0 | 95.7 |
| CY2025 Q3 | 167.1 | 105.8 | 151.7 | 109.3 |
| CY2025 Q4 | 180.9 | 130.7 | 159.9 | 124.8 |
| CY2026 Q1 | 157.9 | 148.4 | 168.5 | 142.4 |
| CY2026 Q2 | 177.5 | 162.6 | ||
| CY2026 Q3 | 187.1 | 185.7 | ||
| CY2026 Q4 | 197.2 | 212.0 | ||
| CY2027 Q1 | 207.8 | 242.0 | ||
| CY2027 Q2 | 218.9 | 276.3 | ||
| CY2027 Q3 | 230.7 | 315.5 | ||
| CY2027 Q4 | 243.1 | 360.2 | ||
| CY2028 Q1 | 256.2 | 411.2 |
Operating cash flow is a measure of how much money a company makes after paying its expenses but before investments like cash capex: it is lower than revenues (which don’t include expenses) and usually higher than profits (which also deduct depreciation). Revenue and profit use accrual accounting, while operating cash flow is cash-based and reflects only payments actually made or received.
Epoch's work is free to use, distribute, and reproduce provided the source and authors are credited under the Creative Commons BY license.
Learn more about this graph
We compare the aggregate operating cash flow of Microsoft, Amazon, Alphabet, Meta, and Oracle against their aggregate cash capital expenditures, quarterly, on a log scale. Operating cash flow is the cash generated by operations before any investment spending. Cash capex is purchases of property and equipment from the investing section. These companies define “free cash flow” as operating cash flow minus cash capex; if their capex continues to grow on trend, their free cash flow will become zero or negative.
Data
All figures are extracted from SEC EDGAR 10-Q and 10-K filings of Amazon, Microsoft, Alphabet, Meta and Oracle. These are, respectively, quarterly and annual financial reporting documents required for all public companies in the US. We parse the structured XBRL tags directly rather than company-reported aggregates.
Tags used:
- Operating cash flow:
us-gaap:NetCashProvidedByUsedInOperatingActivities - Cash capex:
us-gaap:PaymentsToAcquirePropertyPlantAndEquipment(except for Amazon, for which we useus-gaap:PaymentsToAcquireProductiveAssets) - Operating income:
us-gaap:OperatingIncomeLoss(for commentary on continued profitability)
We use cash capex (cash payments for property and equipment) rather than a previously used broader measure that adds new finance leases, because this analysis compares cash out against cash in rather than added capacity. A finance lease commits a company to future payments but involves little cash at signing.
Quarter alignment: Company fiscal quarters fully coincide with calendar quarters except for Oracle. We map Oracle fiscal quarters onto the calendar quarter with which they have the most overlap.
Analysis
We fit an exponential growth model (ordinary least squares on log-transformed quarterly data) from Q2 2023 through Q1 2026, starting with the release of GPT-4. In aggregate, operating cash flow is growing about 23% per year and cash capex about 70% per year; these trends cross around the third quarter of 2026, when aggregate free cash flow reaches zero.
The crossover date differs by company. On current trends, Oracle has already crossed (capex exceeds operating cash flow), Amazon is crossing around now, Alphabet around 2027 Q1, Meta around 2027 Q3, and Microsoft around 2028 Q3.
If capex exceeds operating cash flow and these companies wish to continue increasing capex, they will need to finance this capex through other means. This could include spending down cash assets, borrowing, or raising funds by issuing new equity.
All five hyperscalers remain profitable and increasingly so. While cash capex is paid upfront, it counts against profits gradually in the form of depreciation over the life cycle of the asset.
Assumptions and limitations
- The crossover is sensitive to the fit window — starting the operating-cash-flow fit anywhere from Q1 2022 to Q2 2023 moves the aggregate crossover between roughly Q2 and Q4 2026.
- Operating cash flow is seasonal (e.g. Amazon collects heavily in Q4) and a seasonally adjusted variant delays the aggregate crossover by about a quarter.
- The trend extensions are simple extrapolations of the existing trends, not all-things-considered forecasts. In particular, we do not directly model how the surge in AI-related capex will affect hyperscalers’ future operating cash flow, and whether or not the ROI on AI capex is high enough to increase the growth rate in operating cash.